Data Visualizations
Animated
Does conflict track opium cultivation or transit routes? North Shan (2018–2025)
Fatality-scaled hex grid animation · From: Conflict, Opium & Territorial Control in North Shan
Where does violence concentrate relative to infrastructure? South Kivu (2018–2024)
Fatality-scaled event map · From: Conflict, Deforestation & Mining in South Kivu
Maps
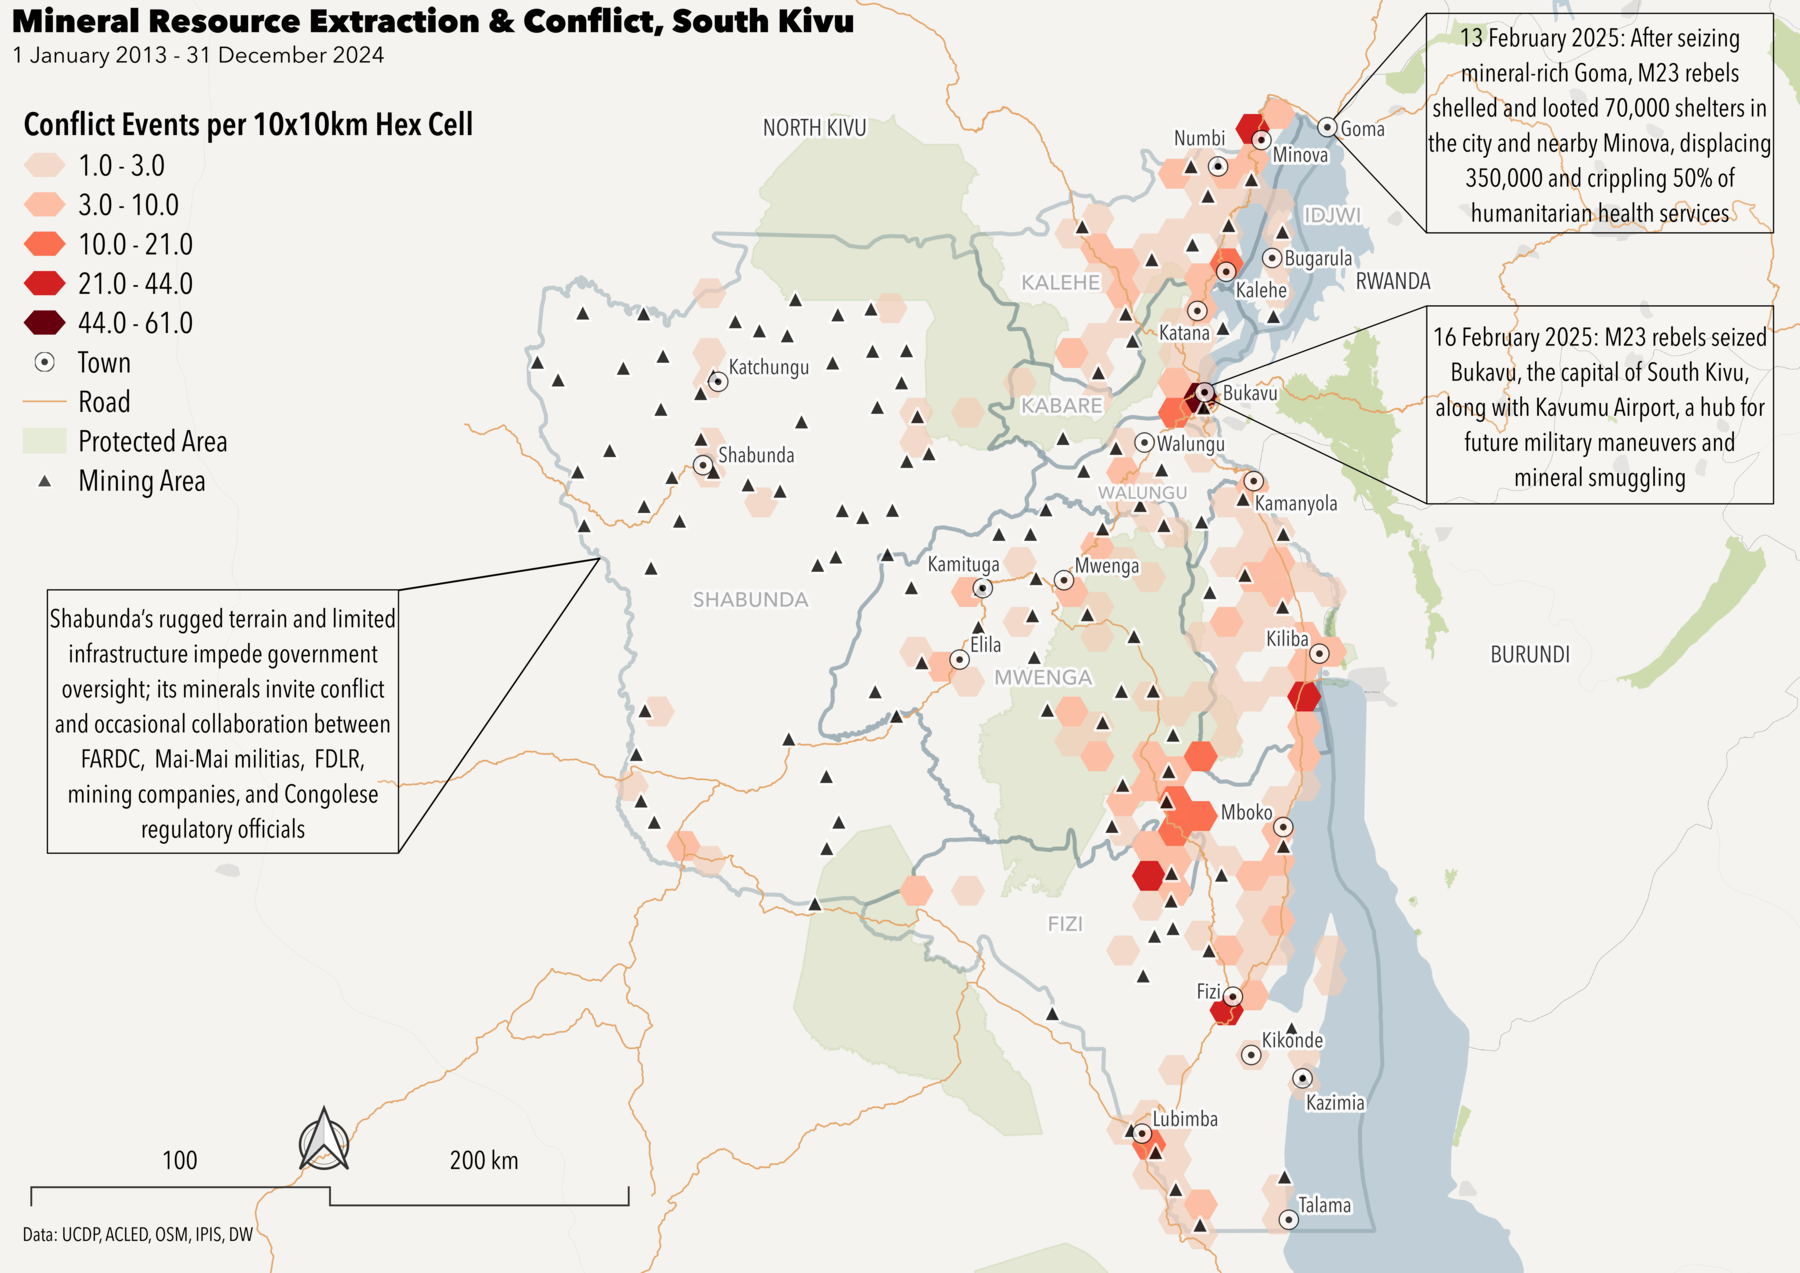
Where do mineral extraction sites overlap with conflict? South Kivu (2013–2024)
Aggregated event density + extraction sites · From: Conflict, Deforestation & Mining in South Kivu
Does road proximity predict cartel violence? Michoacán & Guerrero (2018–2025)
Binned proximity analysis · From: Infrastructure of Violence in Michoacán & Guerrero
How do international transit routes mediate conflict exposure? East Africa
Corridor mapping · From: Conflict, Deforestation & Mining in South Kivu
![]()
Does deforestation co-locate with conflict intensity? South Kivu (2018–2024)
Bivariate spatial analysis · From: Conflict, Deforestation & Mining in South Kivu
Charts
How did conflict tactics shift after the 2021 coup? North Shan (2018–2025)
Disaggregated event type over time · From: Conflict, Opium & Territorial Control in North Shan
Did military and opposition ordnance lethality diverge post-coup? North Shan (2022–2025)
Stacked bar + fatality rate by actor · From: Conflict, Opium & Territorial Control in North Shan
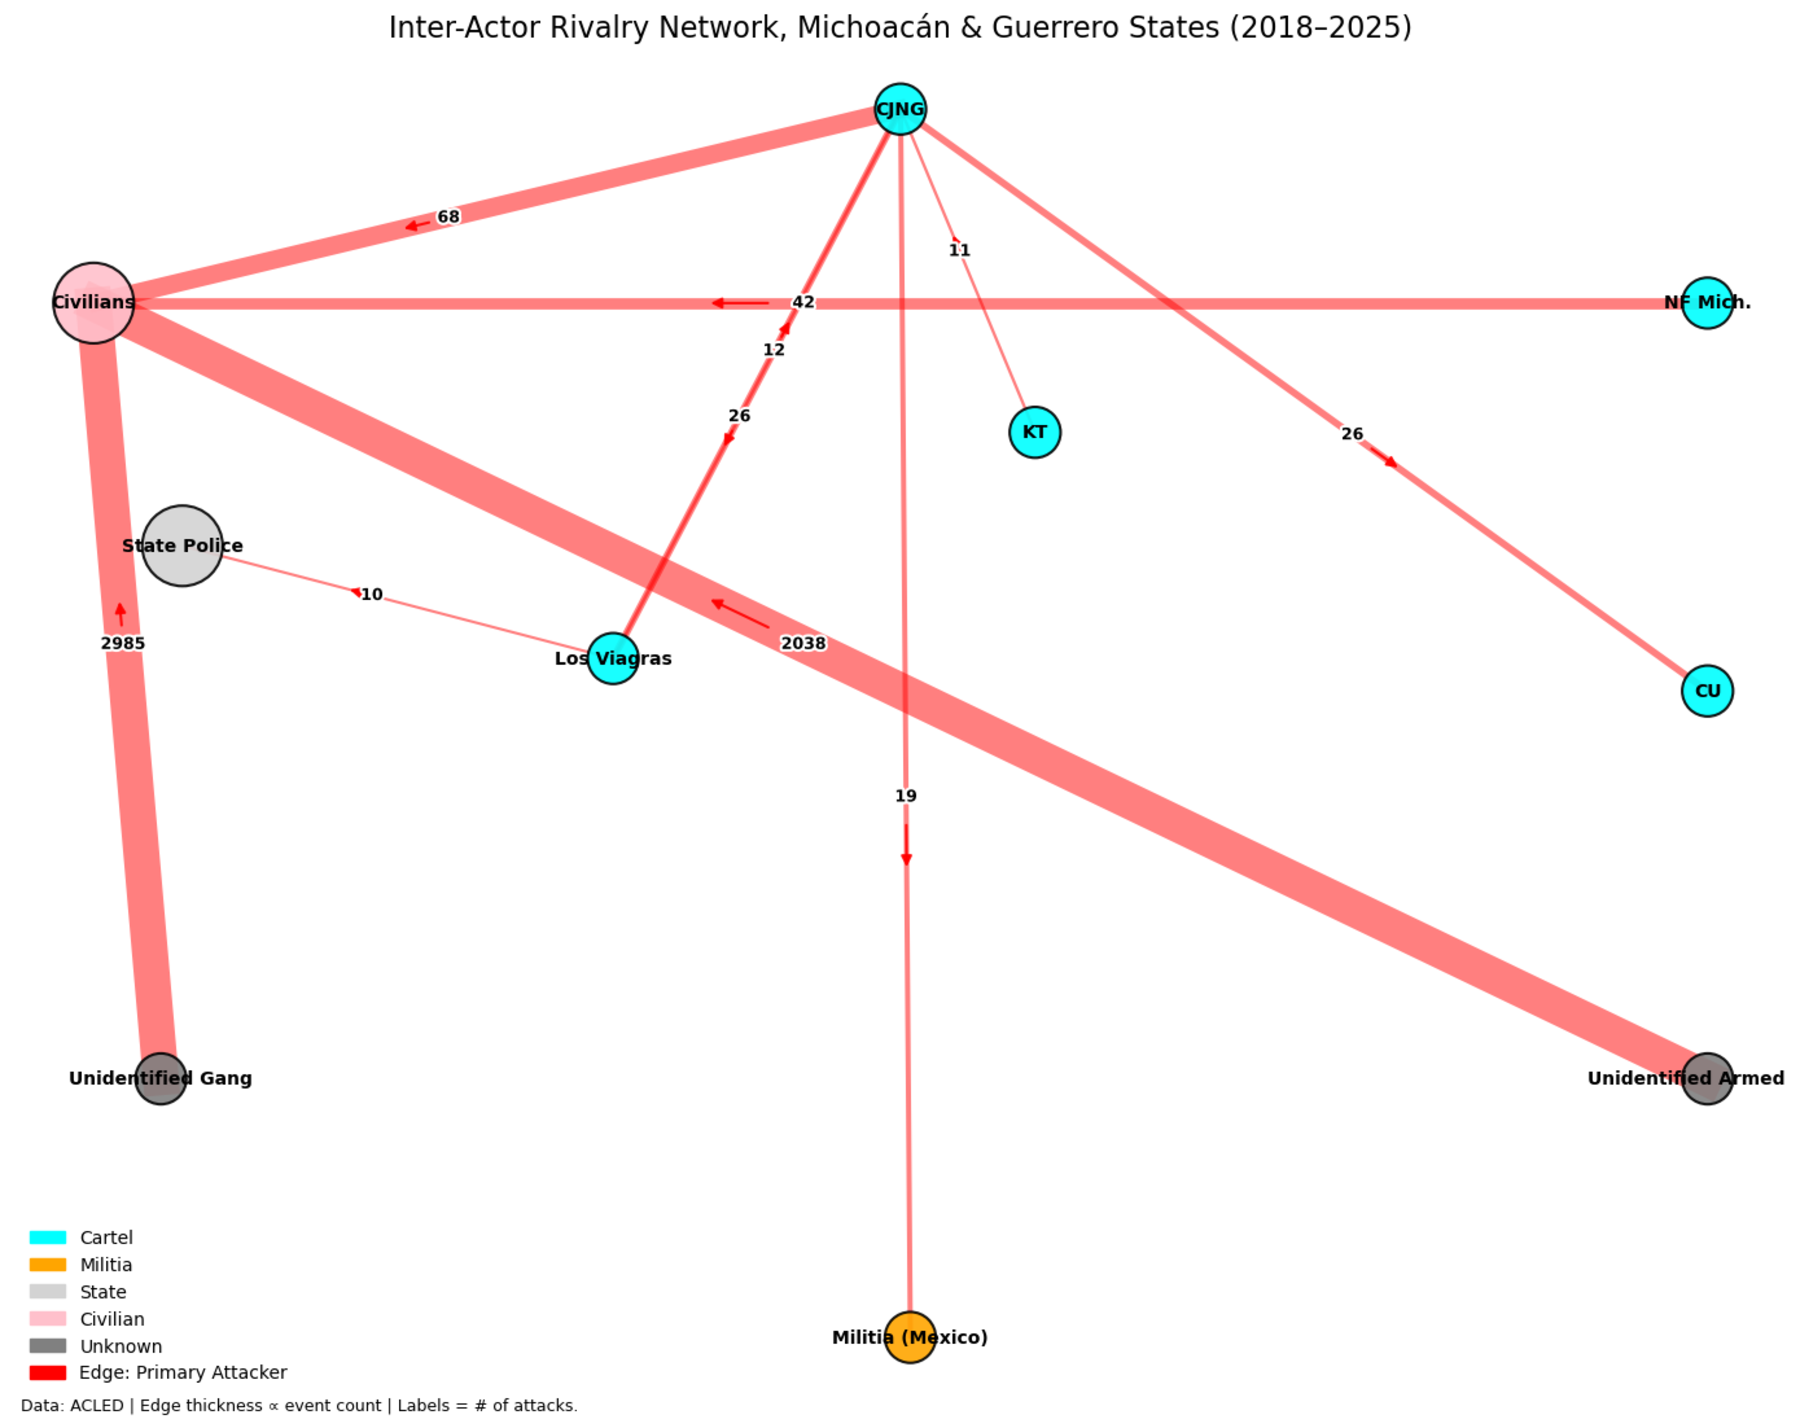
How do cartel rivalries structure violence networks? Michoacán & Guerrero (2018–2025)
Directional actor network · From: Infrastructure of Violence in Michoacán & Guerrero
Models
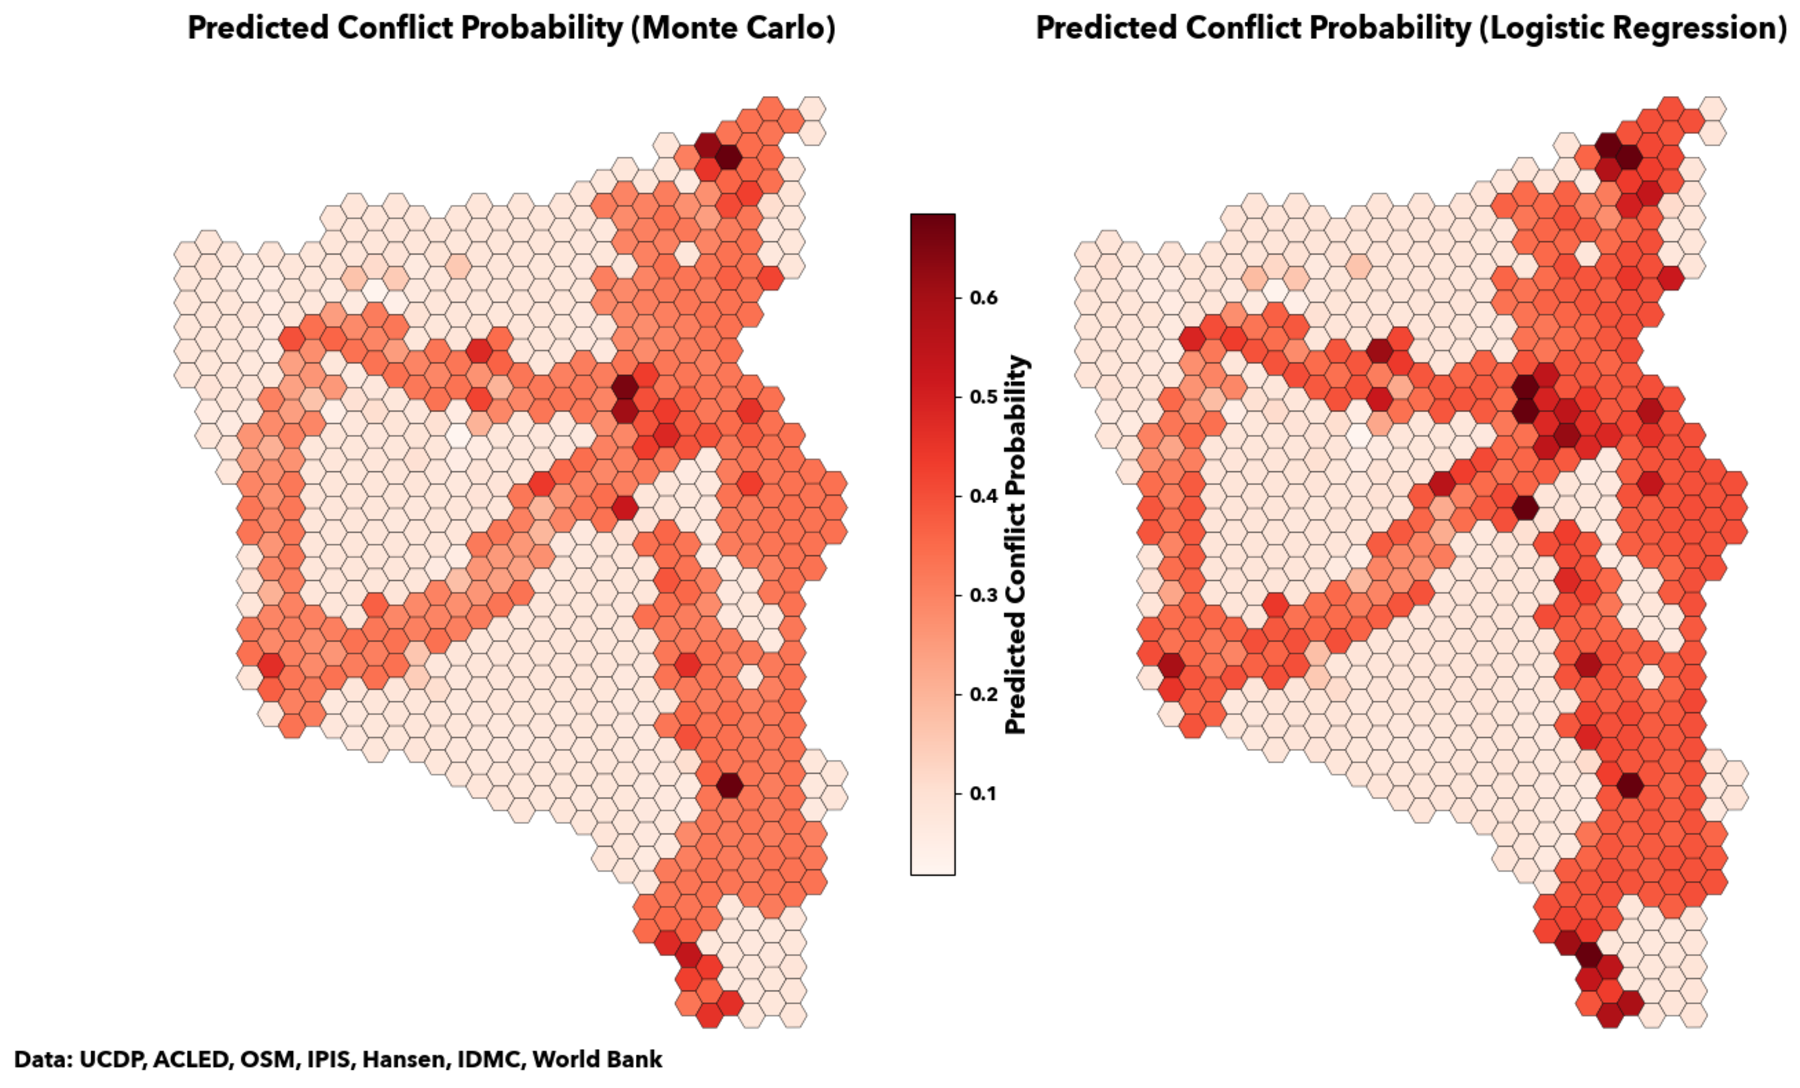
How well do Monte Carlo and logistic regression predict conflict intensity? South Kivu (2018-2024)
Side-by-side model comparison · From: Conflict, Deforestation & Mining in South Kivu
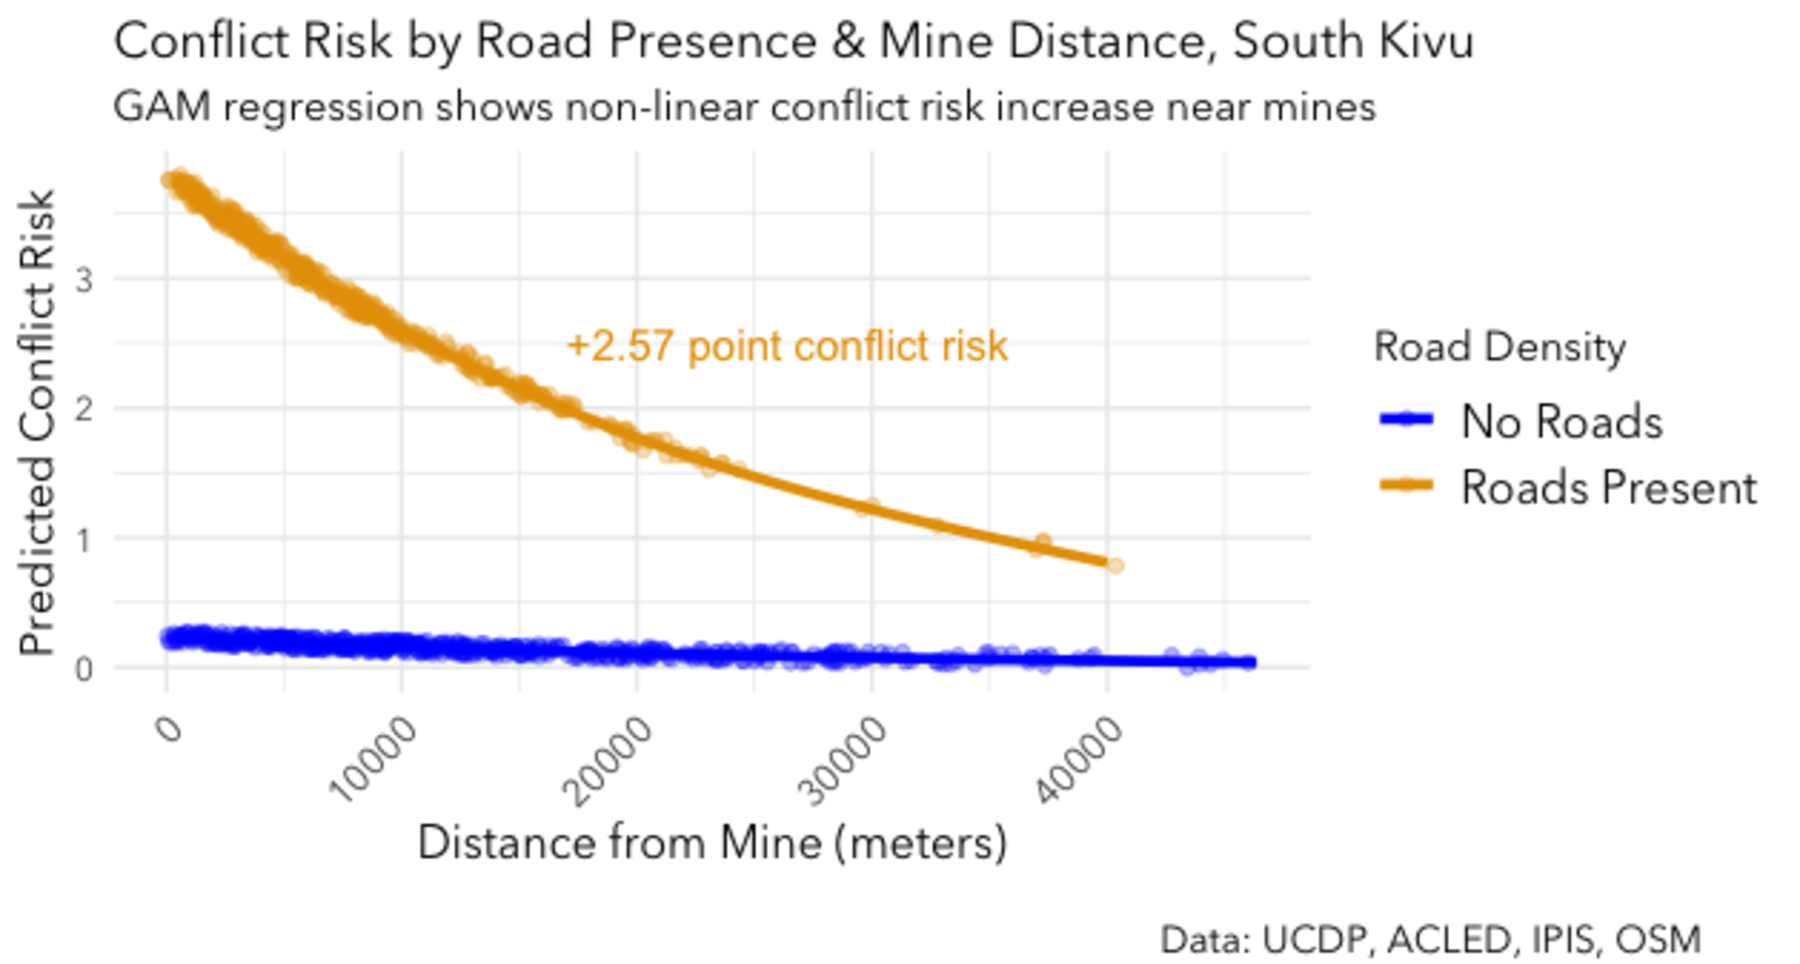
Does road proximity amplify mine proximity’s effect on conflict risk? South Kivu (2018-2024)
GAM interaction term · From: Conflict, Deforestation & Mining in South Kivu